Adviser Top Three Talking Points


1. Multi asset key market highlights


Our strategists summarise market performance and the outlook for next month.

Global equities advanced over the month, as robust earnings results and better than expected economic growth bolstered investor sentiment.

US stocks moved higher after the US Senate passed a budget vote that lawmakers expect will pave the way to a tax overhaul deemed critical to Republicans’ prospects in elections next year. The US economy grew by 3% in the third quarter, beating forecasts of a 2.5% expansion.

European Commission president Jean-Claude Juncker said that the UK would need to pay its “divorce bill” before discussions can proceed on trade and future relations between the UK and the European Union. Meanwhile, the International Monetary Fund singled Britain out as a “notable exception” to an improving global economic outlook – slashing the country’s long-term growth outlook.

The European Central Bank reduced its quantitative easing scheme to a monthly pace of €30 billion from January with the option of extending it beyond September 2018. That amount is down from the current €60 billion-a-month buying pace.

The UK economy expanded faster than anticipated over the third quarter, increasing the likelihood of an interest rate hike at the Bank of England’s next Monetary Policy Committee meeting.


Strategist’s Outlook


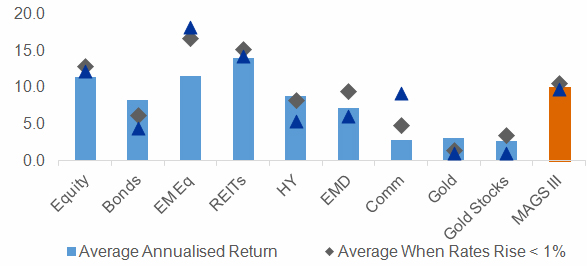
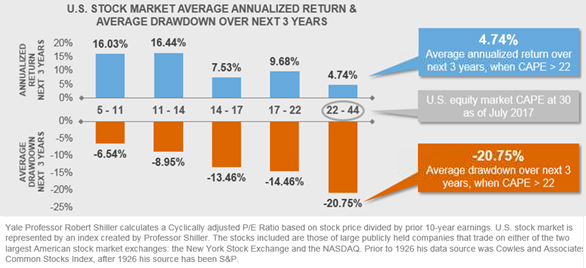
In terms of regions, valuations remain expensive in the US and as such, we still believe that other regions remain more attractive.

As expected, the Bank of England has increased interest rates by 0.25 percentage points to 0.5% - the first rate rise since 2007. We believe this rate hike will be moderately negative to the UK’s economic outlook, especially to the consumption and housing sectors, and this could become a headwind factor for UK equities.


2.Vickers' video: Positioning portfolios for change

Senior Portfolio Manager David Vickers asks whether the second-longest bull market in history is coming to an end….and if so, how best to prepare.


3.Chart of the month: Benefits of diversification


With speculation about when the FED will increase interest rates, and the likely impact, see how different asset classes have responded to past rate rises.

There has been much speculation about when the FED will increase interest rates, and its impact on markets and asset classes.

This chart shows how different asset classes have responded to FED rate rises that are both greater than 1% (grey diamond) and less than 1% (blue triangle) over the last 37 years, with the blue bar showing average annualised return.

The key takeaway is that the results of different asset classes are mixed with equities performing well when interest rates rise, and bonds, conversely, and unsurprisingly, performing less well.

The orange bar at the end of the chart, shows Russell Investments Multi Asset Growth III (MAGS III), which incorporates both asset classes and more, indicates that performance, when FED rates rise, has been a lot more stable than standalone asset classes, with the triangle and diamond nearly overlapping to give a similar return to the annualised return.


RELATIVE MARKET RETURNS OVER ONE YEAR OF FED FUNDS RATE INCREASES

(Annualised % January 1980–March 2017)


Source: Equity: MSCI World Index, Bonds: Bloomberg Barclays Aggregate Bond Index; EM Eq: MSCI Emerging Markets Index (Jan 1988 – Mar 2017); REITs: FTSE NAREIT Equity Index, High Yield: BofA Merrill Lynch U.S. High Yield Index; EMD: JP Morgan Emerging Markets Bond Index (Jan 1992 – Mar 2017); Commodities: Bloomberg Commodity Index (Feb 1991 – March 2017); Gold: Bloomberg Commodity Gold Index (Feb 1991 – Mar2017); Gold Stocks S&P Gold Stock Index; Balanced: 50% Stocks, 30% Bonds, 5% REITS, 5% High Yield, 5% EM, 5% Commodities

Index returns represent past performance, are not a guarantee of future performance, and are not indicative of any specific investment.


Adviser Top Three Talking Points


1. Multi asset key market highlights


Global equities enjoyed a positive start to the 2018, bolstered by robust global growth and positive consumer and business confidence data.

The euro surged to a three-year high, amid hopes for a new coalition government in Germany and signs that the European Central Bank is preparing to rein in monetary stimulus sooner than expected. Meanwhile, UK industrial and manufacturing production data showed that output increased in November, with the manufacturing figures surprising the markets to the upside.

The Bank of Japan surprised markets, when it unexpectedly scaled back its monthly bond purchases of 10- to 25-year debt and 25- to 45-year debt by ¥10 billion each, to ¥190 billion and ¥80 billion respectively.

In oil prices, depleted inventory levels propelled the price of West Texas Intermediate crude oil to its highest level in three years, near $65 a barrel.

Strategist’s Outlook

  • Global Equities: Neutral, despite more signs of euphoria
    • Value: Getting even more expensive, no market cheap
    • Cycle: Earnings strong, recession risk theme for H2 2018
    • Sentiment: More signs of euphoria, but not enough to overpower momentum
    • Prefer Emerging Markets over US
  • Fixed Income
    • Slightly less bearish on government bonds
    • Lighten up further on credit
  • Macro forecasts
    • Fed: 3 rate hikes in 2018, market is pricing ~2.5


2. Multi-asset masterclass with Asset TV

Senior Portfolio Manager, David Vickers discusses why the past two years have been good to investors despite political and geopolitical uncertainty, what the outlook is for 2018 and the advantages of a multi-asset approach. 


3. Chart of the month: Managing the downside has never been more important

Upside potential limited, drawdown potential larger


Given the volatility in the equity market last week and this, the chart above is a timely reminder that managing the “downside risk” has never been more important.

The blue bars show the average annualised three-year return of the S&P 500 at different Cyclically Adjusted Price Earnings (CAPE) levels since the index inception. At levels between 5-11 and 11-14 the returns have been 16.03%pa and 16.44%pa respectively while at higher levels, when the market has been considered overvalued the returns have been lower. At 30 July 2017 the CAPE was 30 and at this level historically the average annualised return has been 4.74% pa over the next three years.

The orange bars show the corresponding average drawdown historically in the next three years at different CAPE valuation levels, so for example historically at CAPE 5-11 and 11-14 levels the average drawdown in the next 3 years was -6.54% and -8.95%. At 22-44 valuation levels historically the average drawdown has been -20.75%.

As the CAPE level at 30/7/2017 was 30 at this level the average annualised return historically over the next 3 years has been 4.74%pa while the average drawdown historically has been -20.75% which demonstrates that managing the downside currently can significantly contribute to an investor's overall return.

To learn more about how Russell Investments’ Multi-asset funds manage the downside please contact the Relationship Management team.

Visit Adviser Acumen for market insights, investment ideas and industry articles.
 

INVESTED. TOGETHER.®


DISCLOSURES

For Financial Advisers Only

Unless otherwise specified, Russell Investments is the source of all data. All information contained in this material is current at the time of issue and, to the best of our knowledge, accurate. Any opinion expressed is that of Russell Investments, is not a statement of fact, is subject to change and does not constitute investment advice. Opinions expressed by readers don’t necessarily represent Russell’s views.

The value of investments and the income from them can fall as well as rise and is not guaranteed. You may not get back the amount originally invested. Past Performance is not a guide to future performance

Index returns represent past performance, are not a guarantee of future performance, and are not indicative of any specific investment. Indexes are unmanaged and cannot be invested in directly. It is not a representation of a projection of the stock market, or any specific investment. Average drawdown is the percentage return from period start date to the market trough within the subsequent three years.

Links to external web sites may contain information concerning investments other than those offered by Russell Investments, its affiliates or subsidiaries. Neither Russell Investments nor its affiliates are responsible for investment decisions with respect to such investments or for the accuracy or completeness of information about such investments. Descriptions of, references to, or links to products or publications within any linked web site does not imply endorsement of that product or publication by Russell Investments. Any opinions or recommendations expressed are solely those of the independent providers and are not the opinions or recommendations of Russell Investments, which is not responsible for any inaccuracies or errors.

Issued by Russell Investments Limited, a company incorporated in England and Wales under registered number 02086230 and with its registered office at: Rex House, 10 Regent Street, London SW1Y 4PE. Telephone 020 7024 6000. Authorised and regulated by the FCA, 25 The North Colonnade, Canary Wharf, London E14 5HS.